


What is "Smart Sampling"!? And how do drones and AI fit in?
From drone scans to visiting the most representative trees in-field: Explore the power of smart sampling, big data, and how to implement it on your farm.

Online platforms now provide “smart sampling” capabilities.
Combining cloud-based technologies with AI and ease-of-use of mobile phones.
Tech like this allows farmers to sample from representative areas, problem hotspots, and areas with variances in crop load.
Yield sampling specifically is a contentious topic.
But with a systems approach to sampling, it can be implemented at scale - objectively.
A new-age smart sampling techniques are removing a lot doubts inherent to the old ways of monitoring (and predicting) yields in orchards, vineyards, and greenhouses.
So what’s the problem with traditional sampling methods?
Manual samples (using hand-held instruments and pen & paper methods) are rarely representative of the whole field. Mostly due to a low sample size relative to the field. But also due to the challenges of dealing with orchard variance.
Orchard variance turns representative sampling efforts into a wild goose chase. And finding areas that are a fair representation of the whole becomes an extremely subjective exercise.
When the number of samples taken in-field are low, there is a greater risk of irregularities due to the low amount of data processed and a greater likelihood of anomalies due to the increased effect that errors in collection have on the final results.
So the logical next step is to increase the sample size.
But that’s easier said than done.
Precise manual measurements take time.
Reliable labour is costly.
Or in short supply.
And even if resources were infinite, there is no way of getting around the phenomenon of simple human error.
Where we increase sample size for manual tasks in order to build a critical mass, it not only takes much longer, but we increase the instances of something going wrong:
inaccurate measurements.
inaccurate record keeping.
…often both.
Digital tools and AI-guided sampling improves data integrity and overall representativeness. Modern approaches lower the margin of error significantly.
Why are larger sample sizes better?
In general, larger sample sizes result in smaller margins of error and more precise estimates. While smaller sample sizes result in wider margins of error and estimates that are less precise.
Precision:
Larger samples provide more information about the population, resulting in more precise estimates and smaller standard errors.
Reducing Sampling Error:
Increasing the sample size reduces sampling error (which is the difference between the sample statistic and the true population parameter).
Example: A sample of 100 will have a larger margin of error than a sample of 1,000.
Meaning that the results of the larger sample will give results closer to the true population value. Provided the sampling method does not skimp on precision.
How digital tools are making an impact
Drone data metrics are providing a solid foundation of per-plant and zonal information that represents true conditions on the ground.
Visiting objectively representative areas has become a reality - and it’s easier to accomplish than ever before.
Plant Health and Performance:
Anomaly detection and pattern recognition (comparing multiple datasets) highlights areas of concern, and possible causes.
Structured task-setting utilises a mobile app to guide the user to exact locations in-field for inspections and interventions.
Record keeping is done in-field quickly and easily via taking notes and pictures in situ all via the app. Some phones allow voice-to-text commentary, making this process even easier.
Back in the office, these recordings are scrutinised and reviewed for careful planning of next steps, if any are required.
Crop Yield Monitoring:
Drone Data Metrics are used to generate representative waypoint locations. Once again, the mobile app guides users directly to these plants for data collection.
Smartphone applications like TrueFruit from the Aerobotics stable of solutions ensure these waypoints are saved and set, so the site can be revisited again and again for recurring observations over time.
TrueFruit further allows for digital sizing of crops like citrus, pomegranates, apples, grapes, blueberries, and macadamia nuts with the simple snap of a button.
Taking 30-50 images per waypoint usually results in a favourable sample size.
There will usually be more than a single waypoint per field. This all depends on the size of the field itself, and the capacity of the user.
The exact number of waypoints making up an ideal sample size is debatable, mainly as each farm, team, and allocated resources will be different. However, a good rule of thumb is at least 1 sample point per 2 hectares (± 5 acres), which together with the 30-50 images per waypoint rule is sufficient enough for a good sample size.
Keep a balanced approach
While technology affords an increase in both accuracy and speed, these very traits makes it easy to get carried away. This can snowball into spending more time in-field than you would like (or can afford) all for the sake of collecting a massive sample size - and simply because it’s possible “and easy to do”.
Forming a structured data collection plan from the starts is an important part of the process. All while remaining flexible if things need to change.
What happens if you are not making to all orchards within a given week or month?
What if one of your devices goes offline, is lost, or stolen.
What if a data collector is ill and not at work this week?
What happens when getting into an orchard for sampling is hampered by the weather, or on-farm activities like crop spraying?
What if your Wifi connection at the main office goes down? What will you do?
As with anything, uncertainty will raise its ugly head. You can count on it.
But as the Scout motto goes…
Be prepared.
Change the sampling plan if you need to, but remain consistent and he point of sampling (how you take down information, or how you collect fruit imagery, etc) so as to produce consistent results and reliable data outputs.
Most of the data collection failures I see by far, are related to user error at the point of collection. In terms of fruit imagery… photos taken out of focus, fruit too far away, or too close. The incorrect orchard is assigned, or a fruit cultivar or variety is not associated with the data collection.
Fruit sizing algorithms and processing models are specific to each cultivar of fruit, berry, or nut. As such having that information ready and setup on the backend helps to streamline data collection and processing.
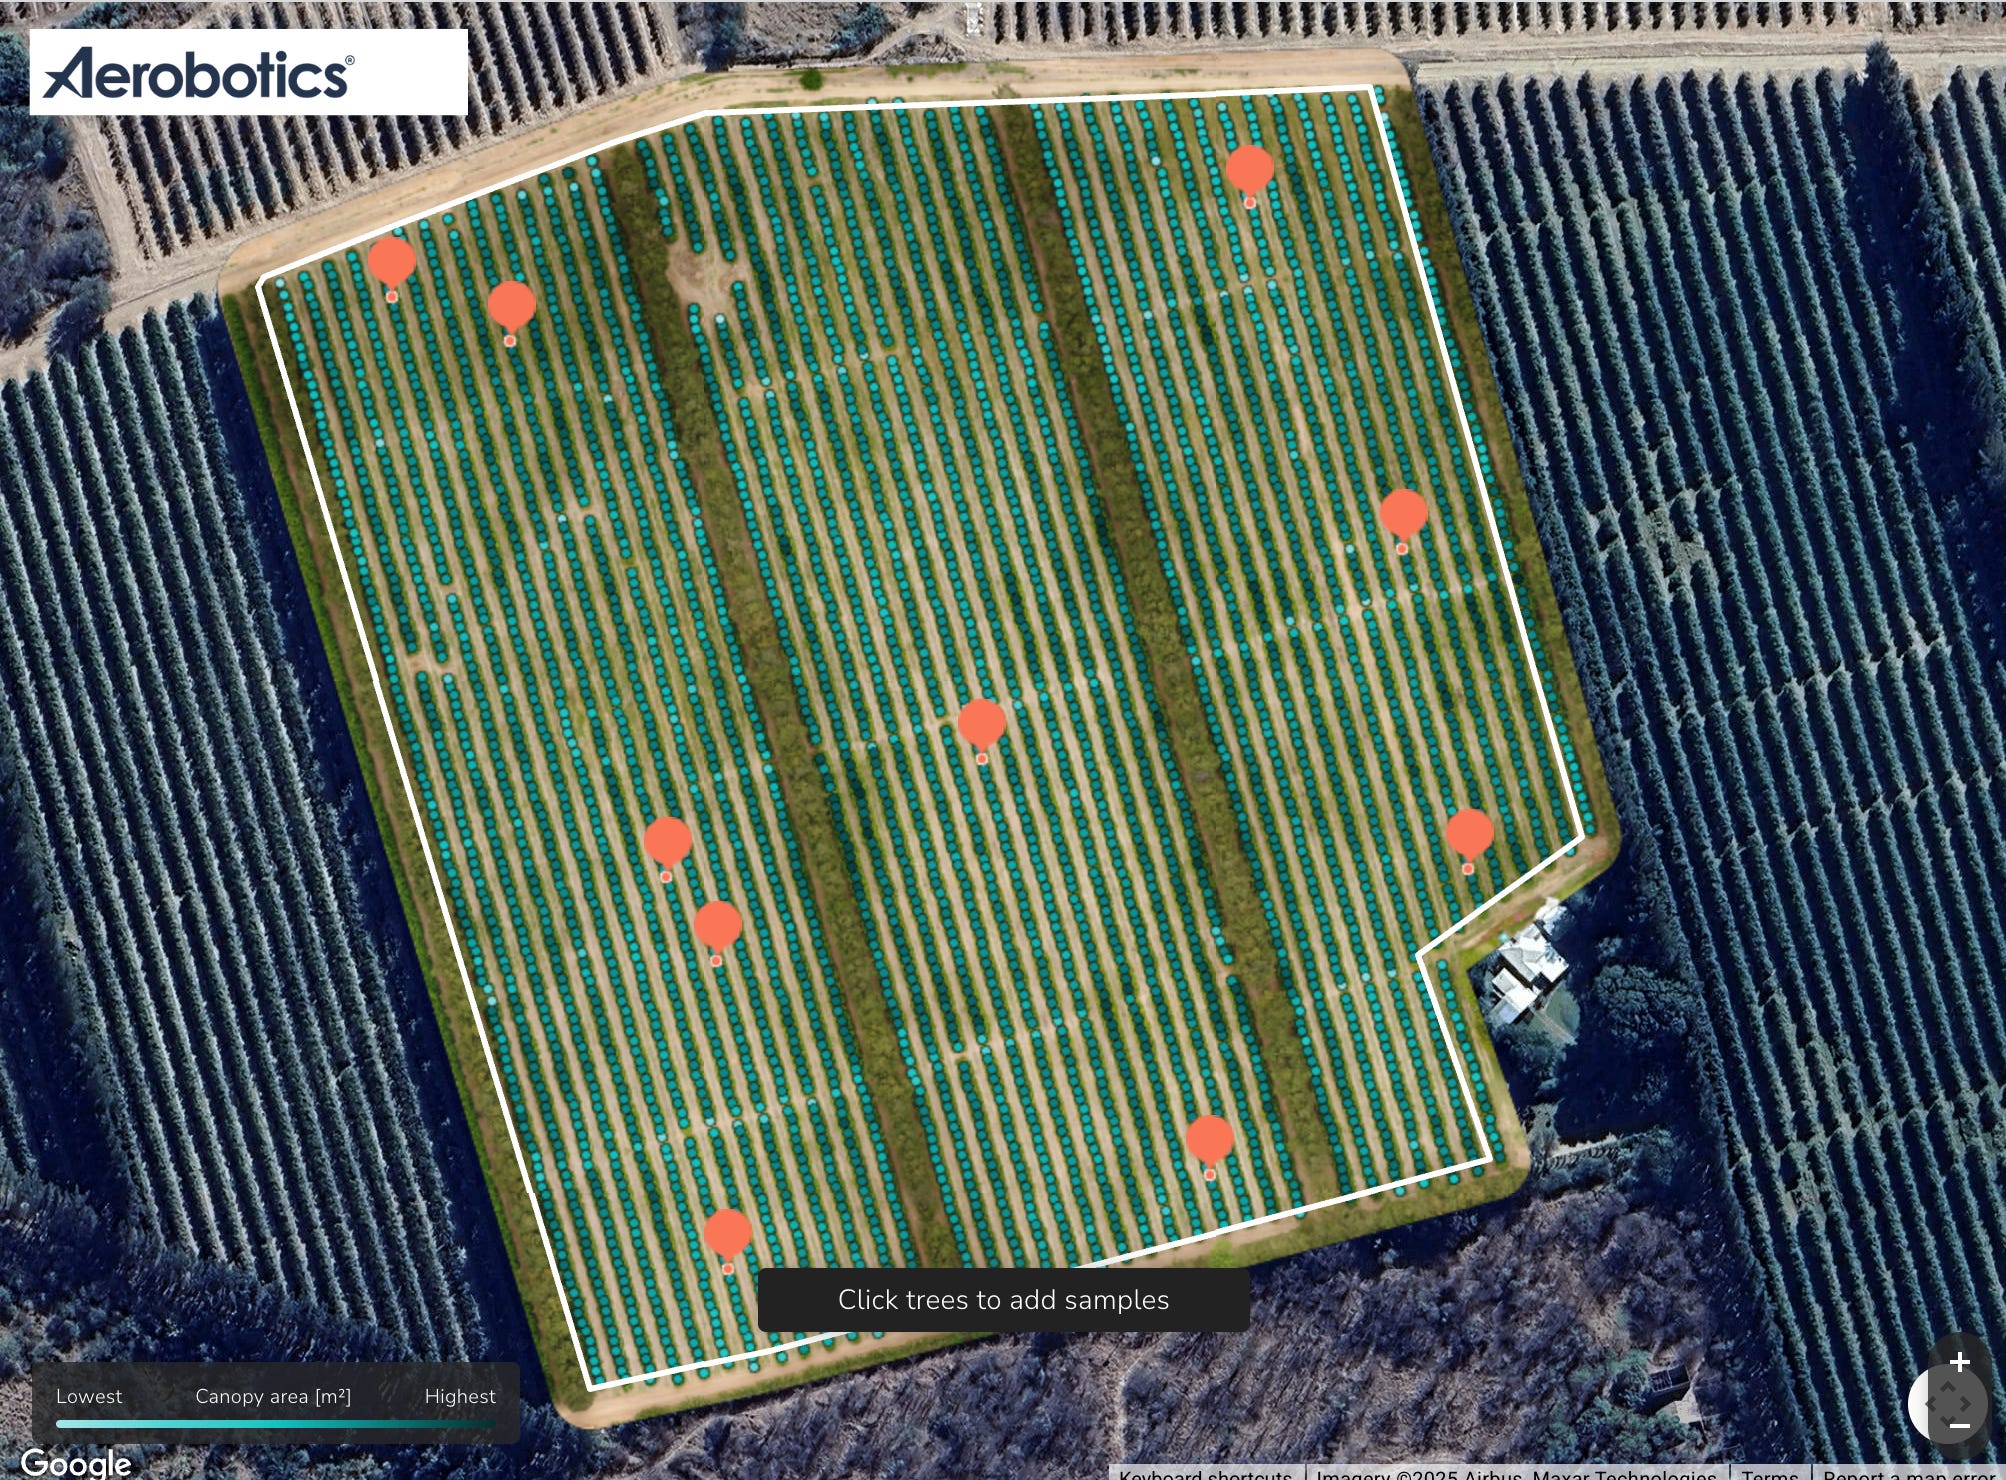
Above: Smart Sampling waypoints are generated by AI, using tree canopy statistics gained from a recent drone survey. Users are still able to override the outputs and plant additional waypoints - although not recommended, as this introduces subjectivity.
For objective and accurately weighted extrapolations (when doing fruit count sampling for example) it is best to have the system formulate an unbiased set of waypoints. The number of waypoints can be set - in this case, 10.
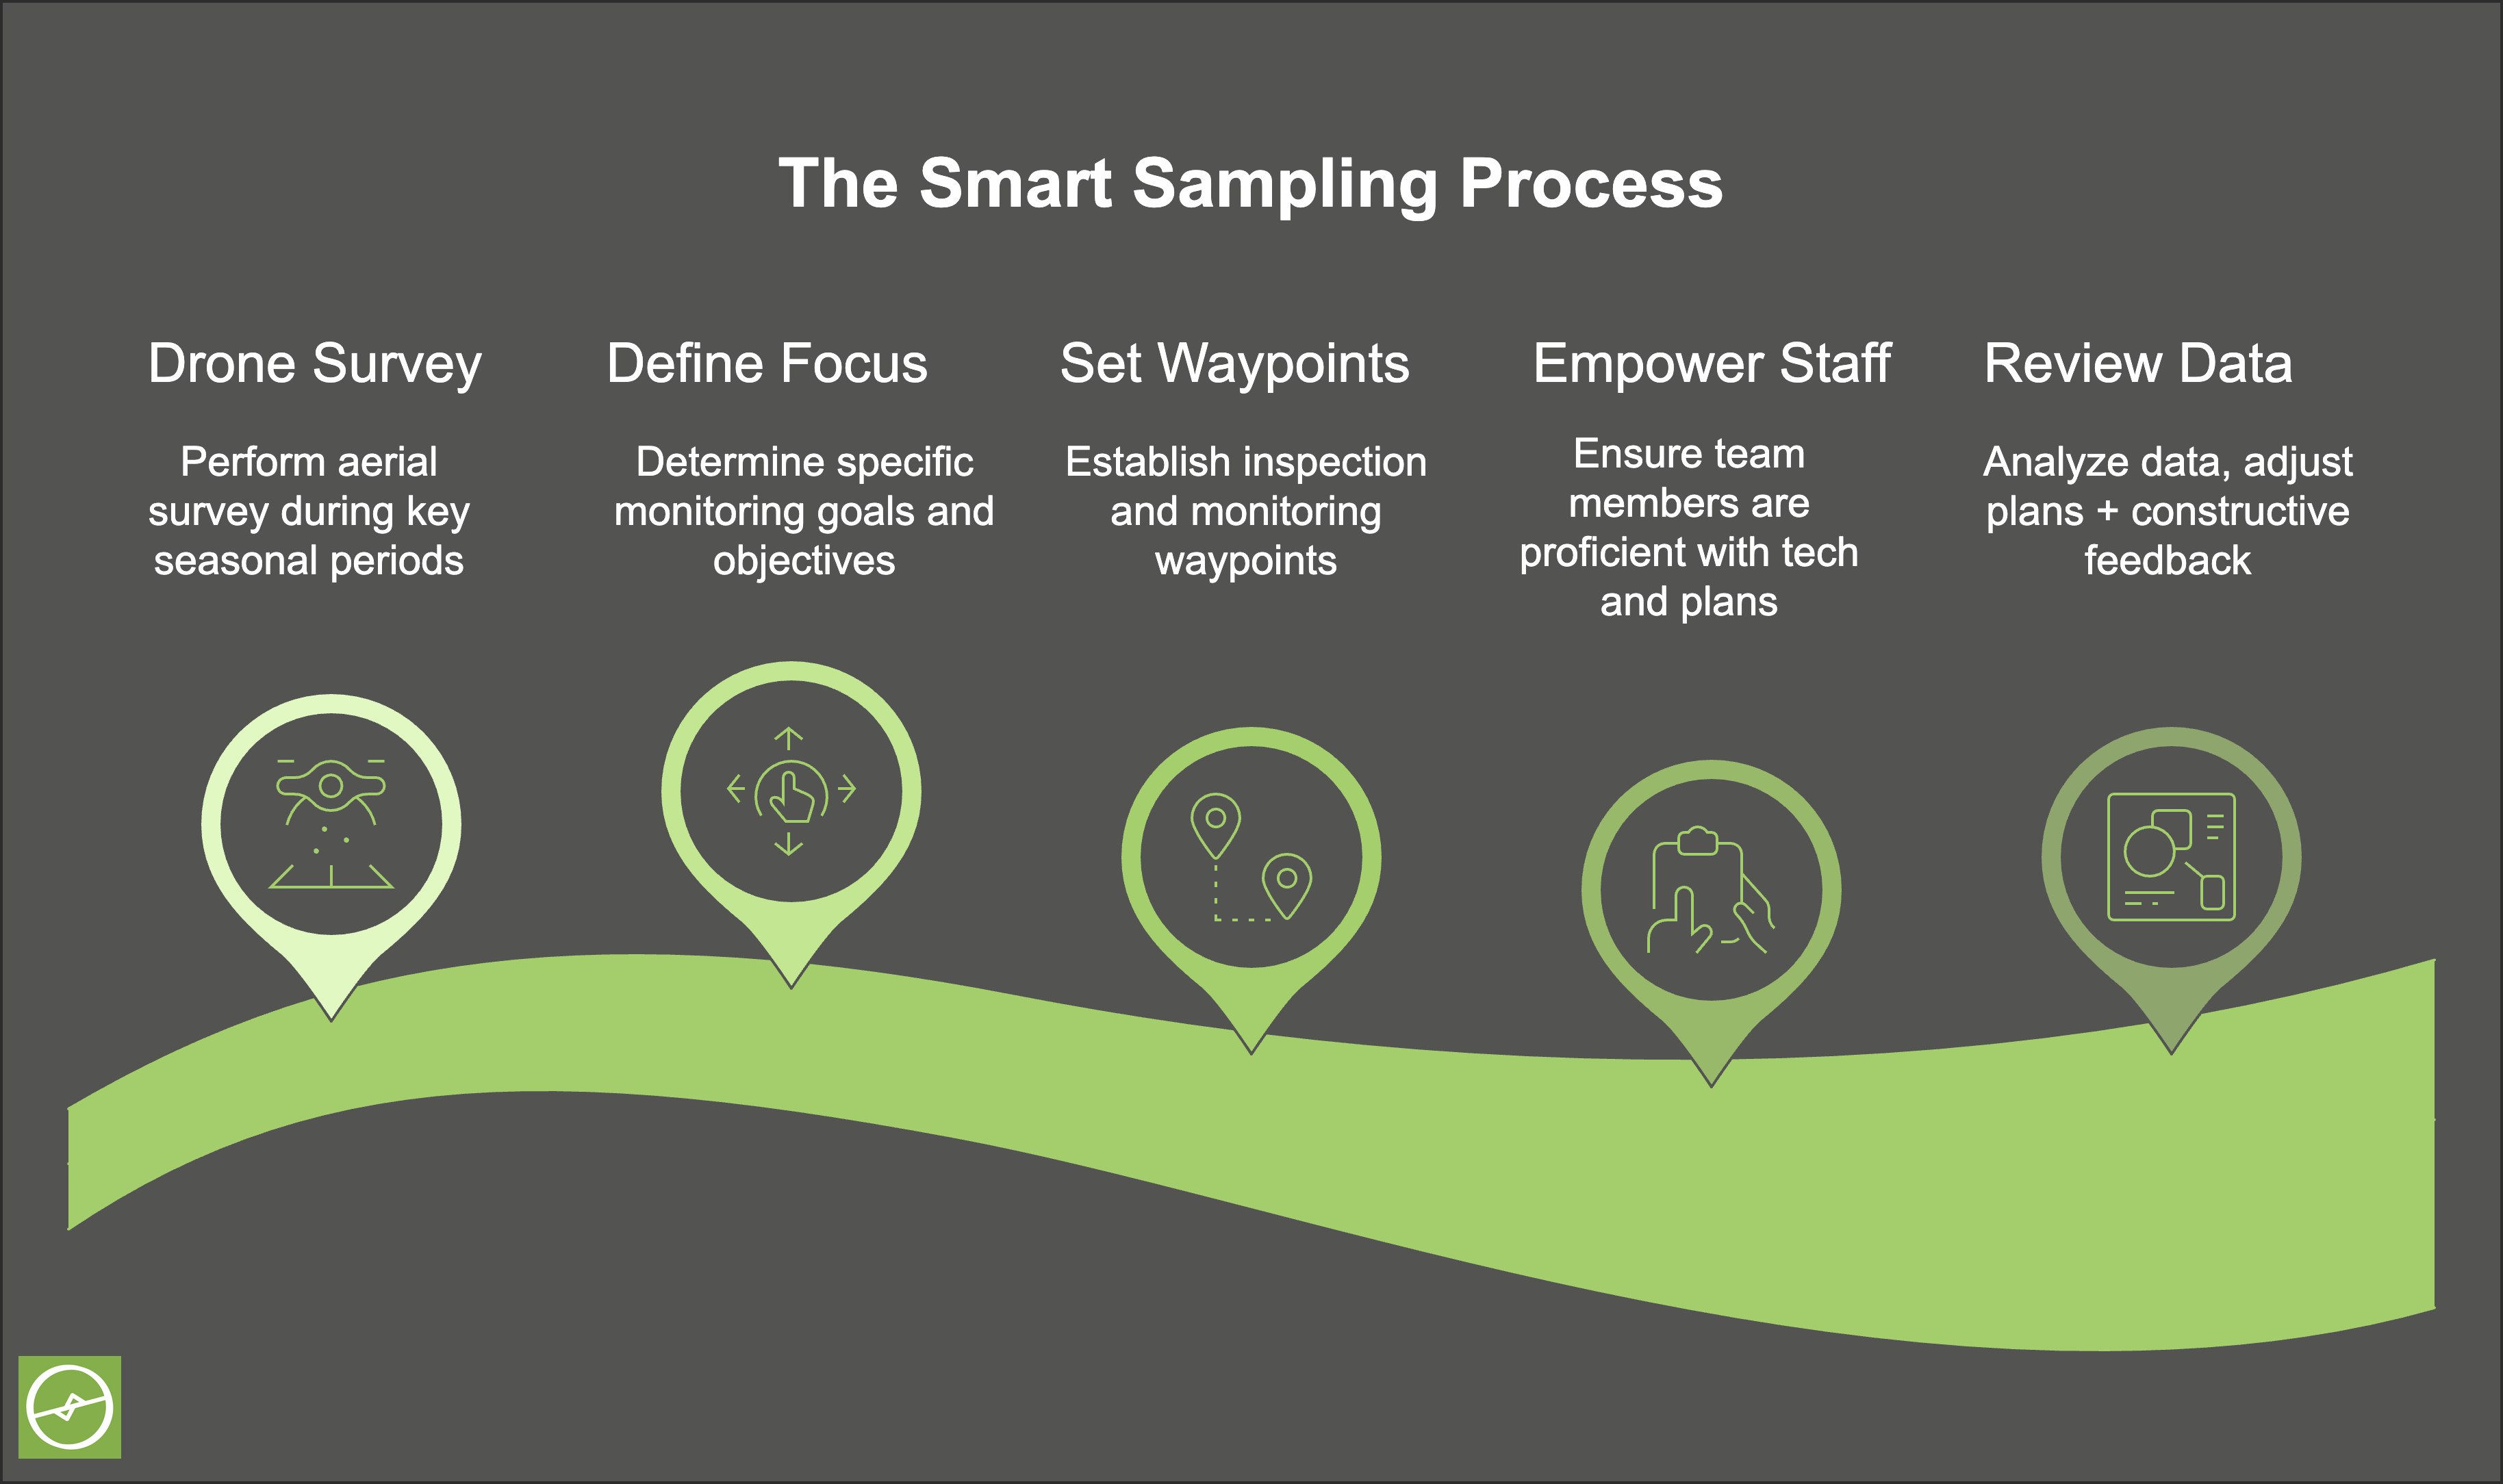
The steps to actioning Smart Sampling on your farm:
Conduct a drone Survey at a phonologically relevant period of the season.
Have a clear plan according to where your focus will lie.
Are you monitoring the status of the fields and plants?
Are you measuring for intervention effectiveness?
Are you aiming to identify issues and problem areas?
Are you using drone data metrics for AI-generated waypoints?
Do you have a structured plan in place for each?
Set Waypoints
Inspection tasks (manual waypoints).
Crop yield monitoring (AI generated waypoints)
Are these recurring (how often), once-off, or seasonal?
Ensure staff are familiar with the technology, the devices, the expected procedures in terms of data collection, and are aligned with the Action Plan.
This includes knowing what the “Plan B, C, and D” plans are - in case something goes wrong.
Review your data, make adjustments to your plan as needed, and send feedback to both your data collection crew, as well as your service provider.
Where are there any bottlenecks?
Do you see any strange data anomalies?
Are you happy with the data outputs and how they are delivered/displayed?
This is a process of continual improvement. The core of the collection operation - that hinges off of the Smart Sampling principle - should be based on your plan. And your plan is based off your objectives.
The very nature of digital recording in-field and the talk-back to platforms based in the cloud means that each interaction with the data is archived without the use of pen-and-paper, loose notes, or Excel sheets.
This reduces any double-data-capture errors (and saving on time).
Data collection errors are minimised (less human error) and the data quality is way more consistent, and mile more reliable.
Of course, every solution is only as good as the underlying code, the interface, and the people behind the magic that makes it all happen.
Check out TrueFruit from Aerobotics if you’re not onboard already.
You might also like:


